
pv magazine test: March 2021 Results
By George Touloupas
This article was originally published in pv magazine – June 2021 edition. Learn more about the pv magazine test here.
pv magazine test involves a range of indoor tests, as well as an outdoor performance test in Gsolar’s test facility in Xi’an, China. Some of these tests are standard in the industry, while others are innovative and provide data on important module quality and performance issues.
March 2021 Test Results Explained
We are glad to present the next batch of energy yield results of the outdoor test field at Xi’an, China. In this issue, the March 2021 results will be presented. This is the last batch of data generated from the outdoor test field before the field was dismantled to be rebuilt, as detailed in the May issue. The construction and equipment upgrade were finished at the end of April, and the generation data of May will be reported in the next issue.
Figure 1 below provides the meteo station data (irradiance and ambient temperature) for the first 10 days of March 2021, prior to dismantling. No new products were added and the installed samples are the same as last month.
Daily Temperature and Irradiance Data

Figure 1: Daily meteo station data - March 2021
Energy Yield Ranking

Table 1: Energy yield ranking
Total Energy Yield

Figure 2: Total energy yield - March 2021
The average bifacial boost is 4.5% for March 2021. Bifacial boost is defined as the extra energy yield of the bifacial products compared to the average energy yield of all mono-facial mono PERC products.
Bifacial Boost
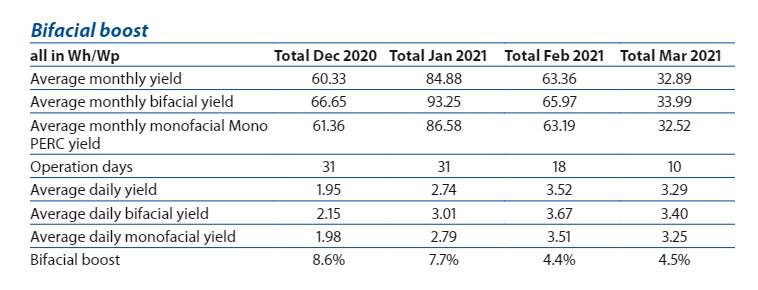
Table 2: Bifacial boost
Figure 4 compares different PV module technologies. Bifacial modules are steadily performing above all the other technologies, with monofacial mono-crystalline modules having the lowest yield.
Relative Yield of Different Technologies

Figure 4: Relative yield of different technologies – March 2021
Energy Yield Measurements
The energy yield comparisons, including bifacial boost, will be analyzed using products installed after the beginning of 2019.
The energy yield is given in Wh/Wp and calculated by dividing the energy produced by the module by the Pmax at STC of the module. This Pmax is the maximum STC power after a process of stabilization.
The results are grouped per module type.
Bifacial boost depends on the bifaciality factor, the installation geometry, the albedo of the ground, the sun angle, and diffuse irradiance. The ground in this case is gray gravel.
George Touloupas is CEA’s Director, Technology and Quality
Test Cooperation
pv magazine test is a cooperative effort involving pv magazine, CEA, and Gsolar. All testing procedures are carried out at Gsolar’s test laboratory in Xi’an, China. CEA supervises these tests and designed both the indoor and outdoor testing procedures.


