
pv magazine test: July 2021 Results
By George Touloupas
This article was originally published in pv magazine – September 2021 edition. Learn more about the pv magazine test here.
pv magazine test involves a range of indoor tests, as well as an outdoor performance test in Gsolar’s test facility in Xi’an, China. Some of these tests are standard in the industry, while others are innovative and provide data on important module quality and performance issues.
July 2021 Test Results Explained
Figure 1 below charts the meteo station data (irradiance and ambient temperature) for July 2021.
4 new products were added to the outdoor test field.
#32 Risen- RSM150-8-500BMDG
#33 Trina- TSM-450DE173(II)
#34 JA- JAM72D20-445MB
#35 JA- JAM72S20-445MR
Daily Temperature and Irradiance Data
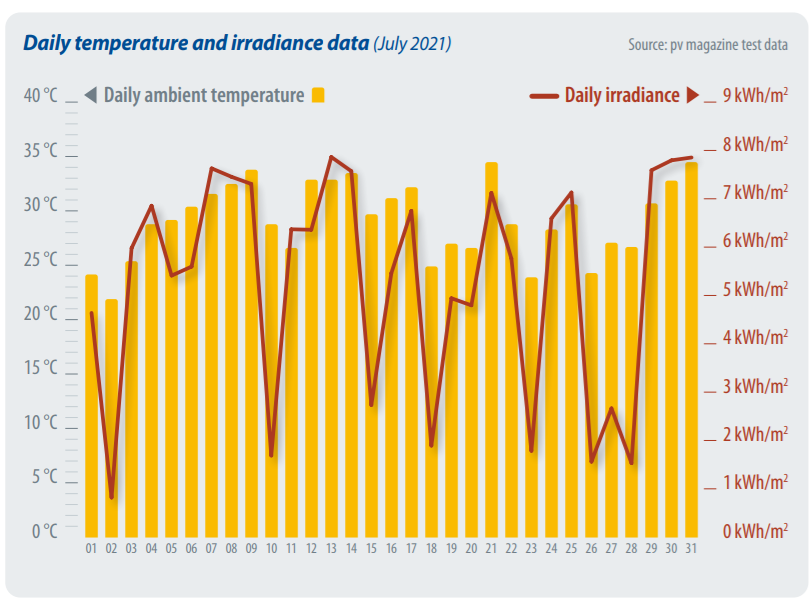
Figure 1: Daily meteo station data - July 2021
Energy Yield Ranking

Table 1: Energy yield ranking - July 2021
Total Energy Yield

Figure 2: Total energy yield - July 2021
As mentioned in the previous month’s article, products 12 and 17 showed abnormal underperformance. As we are still investigating the root cause, they have been removed from the list until the issue is resolved.
The average bifacial boost is 5.7% for July 2021. Bifacial boost is defined as the extra energy yield of the bifacial products compared to the average energy yield of all monofacial mono PERC products.
Bifacial Boost
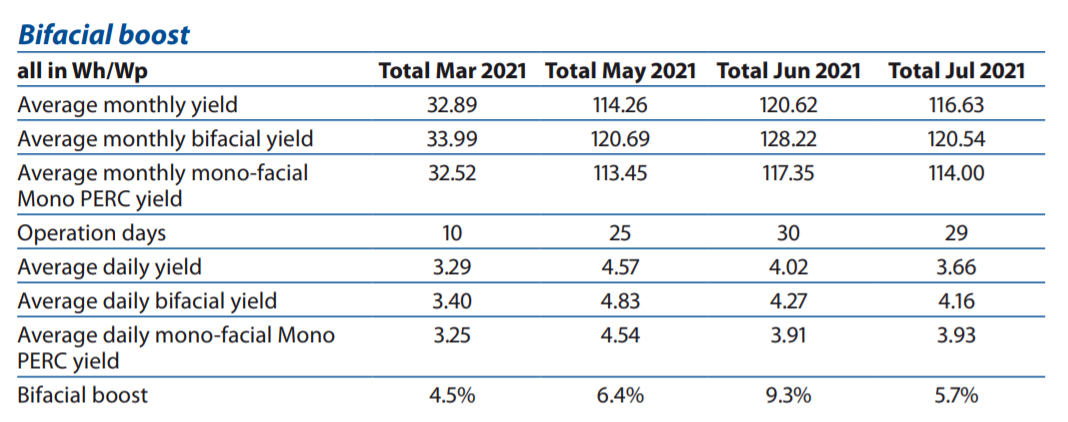
Table 2: Bifacial boost - July 2021
Figure 3 shows the comparison between different PV module technologies for July 2021. Bifacial modules are steadily performing above all the other technologies, with monofacial multi modules having the lowest yield. [Read: LCOE of Monofacial vs Bifacial Modules: Are Bifacials Worth the Extra Cost?]
We have observed that 3 newly installed mono PERC bifacial products (32, 34 and 37) have relatively low yield and have dragged down the overall bifacial boost. We will be closely monitoring these products and the metering set up to understand the underlying cause.
Relative Yield of Different Technologies

Figure 3: Relative yield of different technologies – July 2021
Notes on Energy Yield Measurements
The energy yield comparisons, including bifacial boost, will be analyzed using products installed after the beginning of 2019.
The energy yield is given in Wh/Wp and calculated by dividing the energy produced by the module by the Pmax at STC of the module. This Pmax is the maximum STC power after a process of stabilization.
The results are grouped per module type.
Bifacial boost depends on the bifaciality factor, the installation geometry, the albedo of the ground, the sun angle, and diffuse irradiance. The ground in this case is gray gravel.
George Touloupas is CEA’s Senior Director, Technology and Quality
Test Cooperation
pv magazine test is a cooperative effort involving pv magazine, APsystems, CEA, and Gsolar. All testing procedures are carried out at Gsolar’s test laboratory in Xi’an, China. CEA supervises these tests and designed both the indoor and outdoor testing procedures.


