
How to Use Electroluminescence (EL) Imaging to Detect Module Installation Damage
By Claire Kearns-McCoy
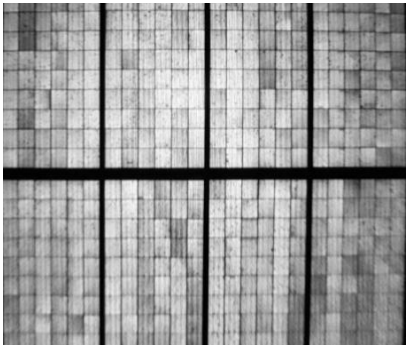
Example of electroluminescence (EL) image of two rows of solar modules
Visual vs. EL Testing to Detect Module Installation Damage: What’s the Difference?
When contemplating the risk and likelihood of solar module quality issues, most of the focus lies on the manufacturing and shipping processes. However, there is still significant potential for module damage during the installation process if proper installation and handling procedures are not followed.
Some of the damage caused by poor installation processes is detectable with a simple visual inspection, such as:
Backsheet scuffs and scratches
Frame damage
Glass scratches
Other damage is invisible to the human eye and requires electroluminescence (EL) imaging to detect, such as:
Cell cracks
Some backsheet scratches and impacts to the rear of the module
When looking to understand the root cause of the damage, it is easier to trace damage found through visual inspections back to installation practices compared to damage detected solely through EL testing. The state of the visual damage may provide hints into how the damage was formed.
Unless pre-installation EL was conducted, it can be hard to prove from EL images alone if damage such as cell cracks occurred during installation or during the manufacturing or shipping processes. However, the combination of EL and visual inspections can provide more detail about the origins of module damage.
Clean Energy Associates (CEA) was recently engaged by an asset owner during the acquisition phase to perform due diligence by conducting visual inspections and EL testing for a 7MW solar project in the US. Aided by the findings of CEA’s inspection, the asset owner succeeded in acquiring a discount on the final project purchase.
This blog will explore the various visual and EL defects detectable after installation, their differences, and when EL testing may be required.
Post-Installation Module Defect Inspection
After arriving onsite, CEA’s engineers performed a visual inspection of 100% of the 20,000 modules on both the front and rear sides. 315 of the modules (1.6%) were randomly selected for EL testing based on ISO inspection standards. The randomly selected modules were selected before the visual inspections and were distributed throughout the site. Further, modules from each combiner box (CB) were tested, with the number of modules tested per CB proportional to the number of strings in each CB.
The EL image analysis for microcracks was conducted independently of visual inspection, and when a backsheet scratch appeared in the EL image, it was later confirmed visually.
Visual Inspection Findings
The most commonly observed visual anomaly while inspecting the 20,0000 modules was backsheet scuffs, as shown in the images below.
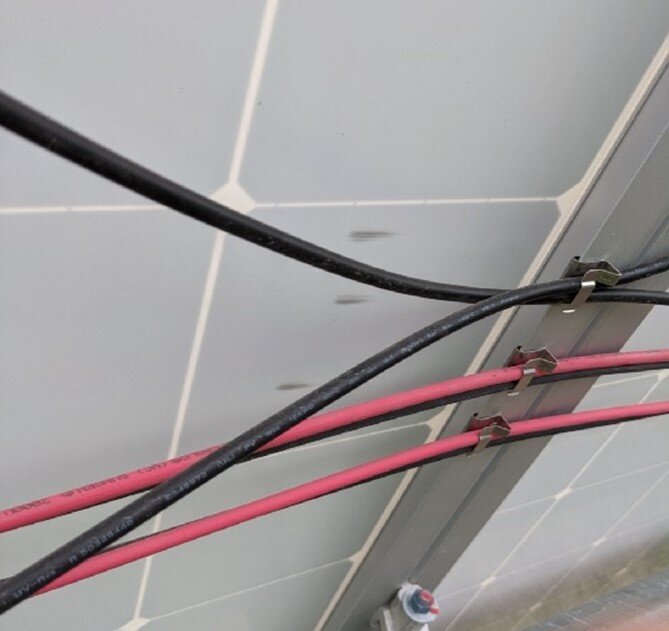

Backsheet scuffs in this case were likely the result of mallets scraping the backsheet while being used to mount the modules onto racks. 553 of the modules, or approximately 2.8%, had backsheet scuffs. The scuffs were most frequently observed in the bottom corners of the module or in the vicinity of the clips used for wire management and represent a risk that the cells were damaged during the impact.
The visual inspection resulted in the following anomalies or defects being detected:
Backsheet scuffs: 553 modules (2.8%)
Backsheet scratches: 29 modules (0.1%)
Glass scratches: 25 modules (0.1%)
Frame damage: 2 modules

The visual inspection detected several anomalies and defects
EL Inspection Findings
By relying on visual inspections alone, the extent that the damage would affect module performance was not clear. The EL inspection of the 315 randomly selected modules, however, told a different story. Whereas the visual inspection only indicated 3.1% anomalies/defects, the EL image testing revealed that 17.5% of the modules tested contained microcracks, 23.8% contained impact points, and 1.6% contained backsheet scratches.
Microcracks
Microcracks are a type of defect that cannot be detected with visual inspection alone. Microcracks are cracks in the silicon wafers formed due to damage either during manufacturing, shipping, installation, or operation that have the potential to develop into a loss of active area and reduce the output of not only the modules containing microcracks but the entire strings containing a defective module. Over time microcracks can lead to diode activation or hot spots that represent a safety risk.
Microcracks can be divided into different categories based on shape.
Line microcracks are cracks that appear in a single, linear line. Line microcracks were present in 7.6% of the modules tested.
Complex microcracks are microcracks with an x, y, or branched shape. Complex microcracks were present in 12.1% of tested modules.
EL imaging can also indicate the presence of an impact point – the areas where an impact to the rear of the module is visible in the EL due to damage to the rear side of the cells. 23.8% of the modules tested contained impact points in the EL images. In some cases, these impacts resulted in microcracks visible in EL images at the time of inspection, while in others they did not.

EL image of a sampled module showing line cracks, complex cracks, and impact points

Backsheet Scratches
While backsheet scratches were identified in only 0.15% of the modules during the visual inspection, they were present in 1.6% of the EL images. Many smaller backsheet scratches are challenging to find during a visual inspection but appear clearly in an EL image.


The same backsheet scratch in EL image (left) and visual inspection (right)
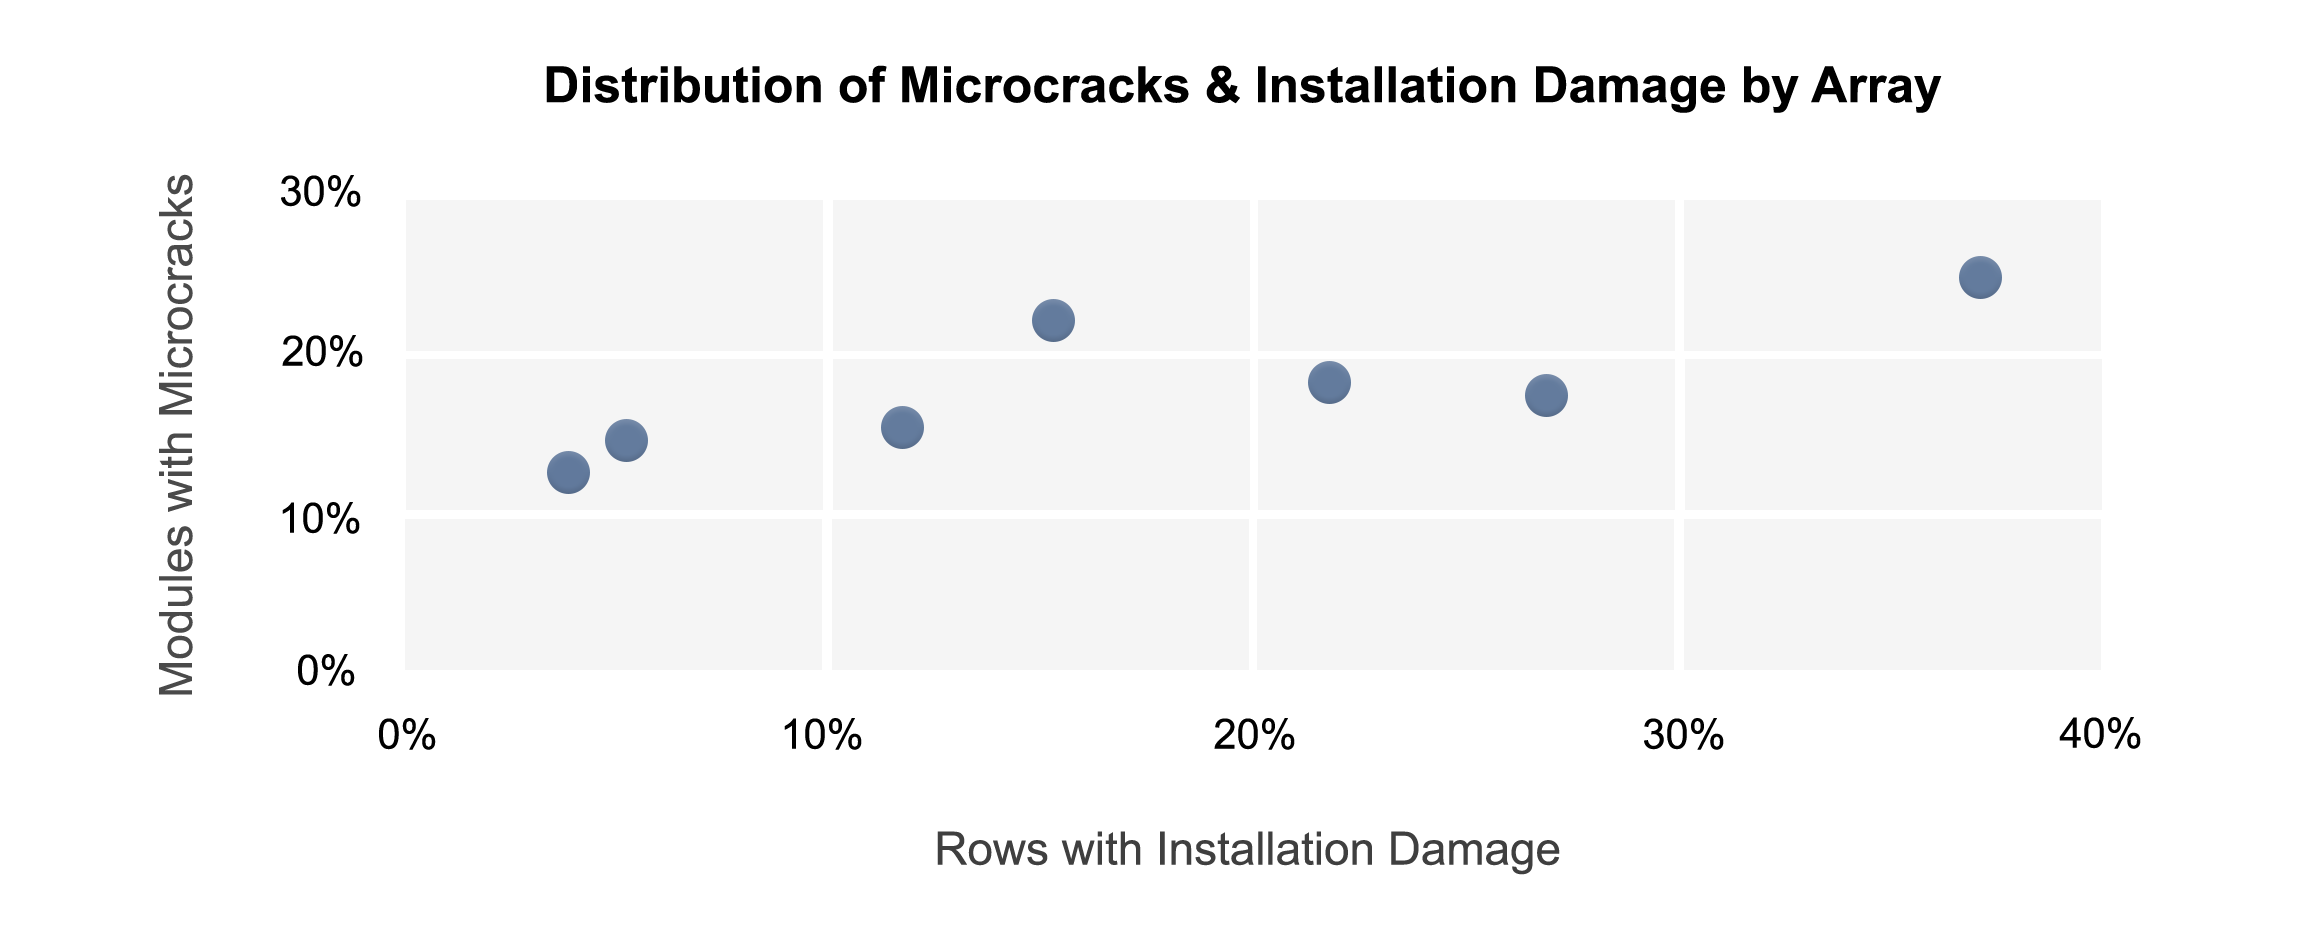
Correlation Between Visual and EL Findings
Correlation was observed between modules tested with microcracks and the rows with visible installation damage in each array.
Impact points were most frequent in the cells on the bottom corner, which was one of the most common locations for backsheet scuffs.
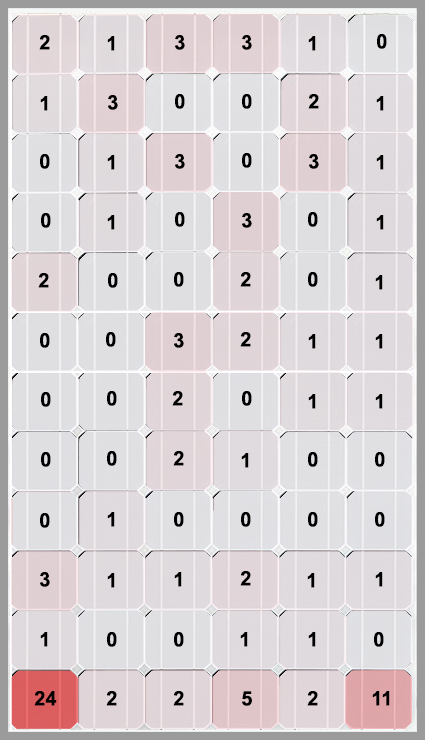
Location of impact points within the module as seen from EL images
EL Imaging Provides Deeper Insight into Module Installation Damage
While certainly some installation damage can be detected on modules with a simple visual inspection, uncovering the true extent of the damage requires the use of electroluminescence imaging. And even some defects, such as certain backsheet scratches, which can be detected during visual inspection may still be missed without the use of EL imaging.
And while the cause of the damage shown through the EL testing may not always be 100% conclusive, correlation can be observed between microcracks and visible installation damage. In the case of this project, arrays with more visible damage caused by installation practices had more microcracks.
In many instances it was almost beyond doubt that the installation practices that resulted in the backsheet scuffs resulted in cell damage detectible in EL, even in modules without visible scuffs.
Mitigate Risk and Optimize Your Solar Energy and Storage Investment
From dealing with severe climate events that result in equipment failure and warranty claims, to optimizing performance and design specifications, PV installations require a high level of technical proficiency to expertly balance safety, performance, and cost.
CEA provides technical due diligence and engineering services for solar and storage clients around the globe who are financial institutions, project developers, EPCs, IPPs, and PV power plant owners. Upstream, our team of engineers travel to factories around the globe to conduct in-factory quality assurance via audits, production monitoring and pre-shipment product inspection.
Feel free to reach out to us to inquire further about our upstream and downstream services.
Claire Kearns-McCoy is a Project Manager/Solar Engineer at CEA, where she has extensive experience conducting field testing and interpreting test results for PV modules, including electroluminescence imaging and analysis.


