pv magazine test: January 2024 Results
By George Touloupas
This article was originally published in pv magazine – March 2024 edition. Learn more about the pv magazine test here.
George Touloupas, senior director of technology and quality for Clean Energy Associates (CEA), analyzes the January 2024 energy-yield results from the outdoor testing field in Xi’an, China.
After one month down for upgrades, the new array was brought online in mid-January, after which 15 days of data were collected. Results from the first bifacial heterojunction (HJT) module in the test program are included. A new bifacial tunnel oxide passivated contact (TOPCon) module from SEG Solar was also added to the array.
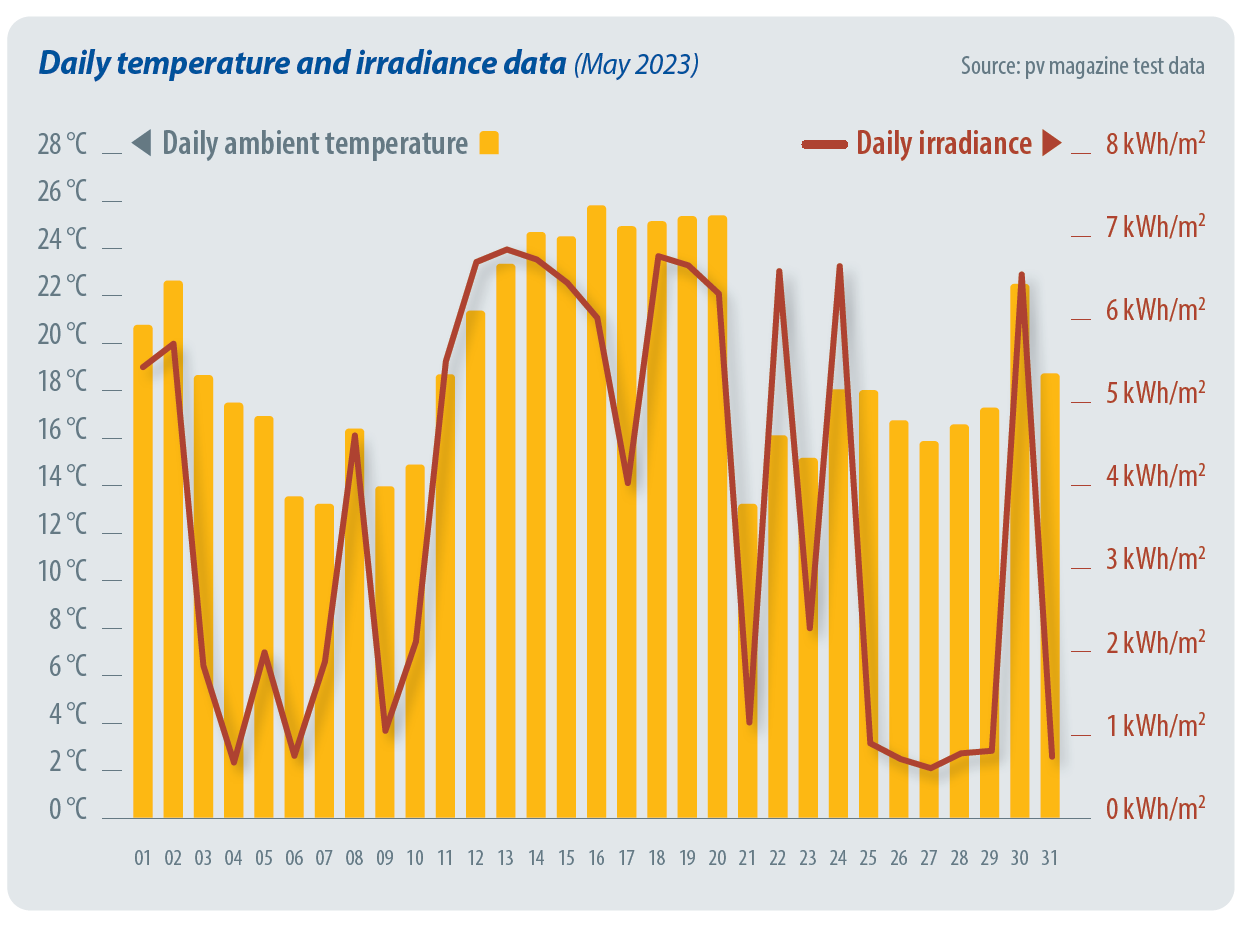
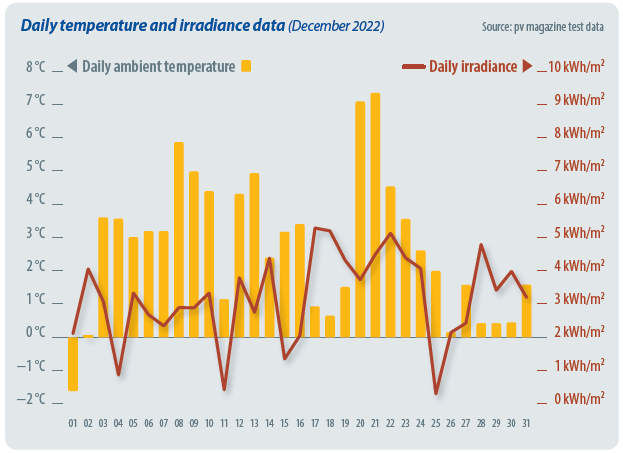
A total of five products had to be removed from this month’s results, as two presented irregular performance requiring investigation, and three temporarily lost connection with the data collection system. The first chart below shows the meteo station data (irradiance and ambient temperature) for the second half of January 2024.

Figure 1: Daily temperature and irradiance data - January 2024
The average bifacial boost is 4.17% for January 2024. Bifacial boost is defined as the relative advantage of the average specific energy yield of all bifacial products compared to the average specific energy yield of all monofacial PERC products.

Table 1: Bifacial boost - September 2023 to January 2024
Monthly highlight
In the monofacial product ranking for January, Recom’s older technology mono back surface field product got top rank while Aiko’s TOPCon back contact product ranked last. This may seem counterintuitive, but a look at the climatic conditions explains everything. For most of the days that data was collected, the temperature was just above or even below 0 C. Older technology products have Pmax temperature coefficients close to -0.45 % per degree Celsius, as opposed to -0.35 % per degree Celsius for PERC, -0.29 % per degree Celsius for TOPCon, and -0.26 % per degree Celsius for Aiko’s BC. For older panels, operation in a cold environment increases the power faster than modules with “better” coefficients, and this explains the observed results for January.

Table 2: Specific energy-yield ranking of n-type bifacial (TOPCon and HJT) modules - January 2024
Table 3: Specific energy-yield ranking of bifacial PERC modules - January 2024
Table 4: Specific energy-yield ranking of monofacial modules - January 2024
Energy yield measurements
The energy yield comparison among various technologies, including bifacial boost, has been analyzed using products installed after the beginning of 2019.
The energy yield was given in Wh/Wp and calculated by dividing the energy produced by the module by its maximum power point (Pmax) at standard test conditions (STC) for the module. This Pmax was the maximum STC power after a process of stabilization.
The results have been grouped into categories, per module type.
The bifacial boost depends on many parameters: bifaciality factor, installation geometry, albedo of the ground, the sun angle and diffuse irradiance. The ground, in this case, is gray gravel.

Figure 2: Specific energy yield of n-type bifacial (TOPCon and HJT), bifacial PERC, and monofacial modules - January 2024

Figure 3: Relative yield of different technologies - January 2024
Test cooperation
pv magazine test is a cooperative effort involving pv magazine, CEA, Gsolar and Hoymiles. All testing procedures are carried out at Gsolar’s test laboratory in Xi’an, China. CEA supervises these tests and designed both the indoor and outdoor testing procedures.